PHP Performance Profiling with SPX and Laravel Sail
Performance Problems Are Not Always Obvious
Performance problems are often much harder to diagnose than ordinary bugs. When an application returns an incorrect result, there is usually a specific part of the code that can be investigated. When an application is simply slow, the cause can be spread across many different parts of the execution.
A request might spend most of its time executing unnecessary operations, unoptimized business logic, external services, or seemingly insignificant operations that could be missed at first glance. Looking only at the total response time does not reveal which of these is responsible.
This turns performance optimization into a game of guesswork. Is the environment not configured correctly? Has the issue been introduced by your code? Perhaps by an upstream change? You start to debug code that you assume to be the cause, perhaps you even modify the implementation just to measure the time spent on specific calls.
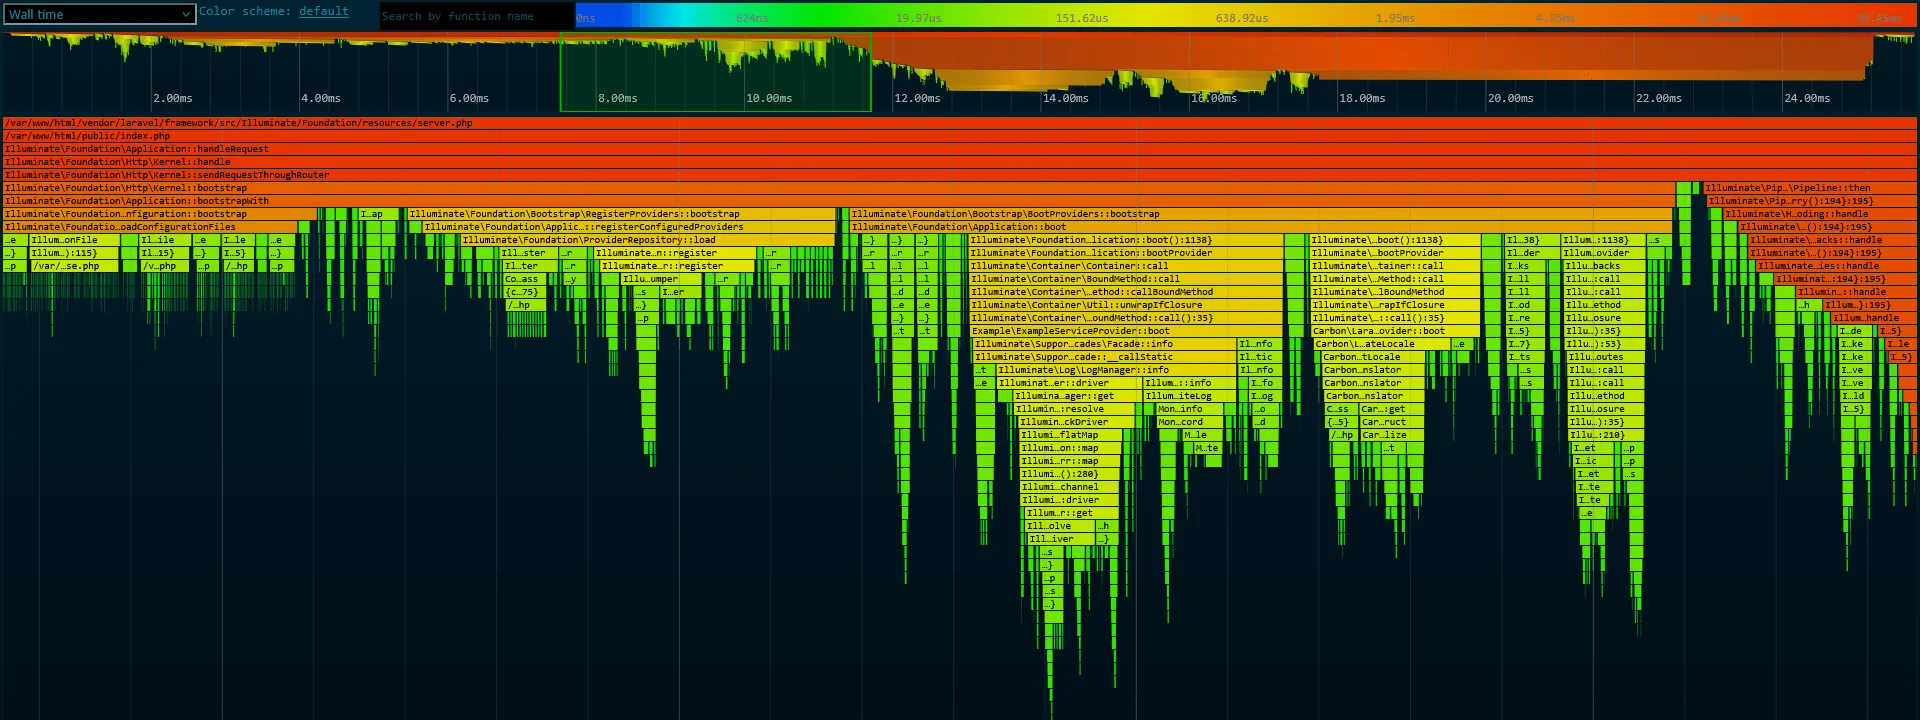
Profiling provides a way out of that guessing game. Instead of guessing what might be slow, we can precisely observe the performance impact of every single call in a code path to determine what the application actually does while it runs and use that information to decide where further investigation is worthwhile.
Meet PHP SPX
A Profiler for PHP
PHP SPX, short for Simple Profiling eXtension, is a PHP extension designed specifically for profiling applications. It collects information about the execution of PHP code and provides a web UI for examining the resulting profiles.
One of the things that makes SPX useful is that as a PHP extension it operates between the userland code and the Zend engine. This allows SPX to provide insight into the code being executed without requiring changes to the implementation itself.
The profiler can be used with regular PHP applications as well as popular frameworks such as Symfony and Laravel. This makes it useful both for investigating isolated pieces of code and for looking at the performance of complete application requests.
Rather than simply reporting that a request took a certain amount of time or what database queries were involved, SPX helps break down that execution into the individual operations that contributed to it.
Why I Use SPX Alongside Xdebug
I strongly believe that different tools excel at different tasks.
When debugging an application, the important question is usually why the program behaves incorrectly. Here the beloved tools provided by Xdebug such as step debugging, conditional breakpoints and variable inspection allow the program's control flow to easily be followed.
Performance investigations however are different. The profiling functionality provided by Xdbeug is quite rudimentary. PHP SPX shines by using a flame graph to break down requests into every method in their code path while providing further information such as memory usage, used objects, I/O and more.
This makes SPX a useful complement to Xdebug rather than a replacement for it. Xdebug excels at investigating behavior; SPX excels at investigating performance.
Setting Up SPX in Laravel Sail
Installing the Extension
Before SPX can profile an application, the PHP extension itself needs to be installed.
Unlike extensions that are readily available as pre-built packages for a given environment, SPX may need to be compiled from source. For Docker-based development environments, this can be incorporated directly into the image so that every container created from it has the profiler available.
# Install PHP-SPX from source
RUN apt-get update && apt-get install -y autoconf make gcc git \
    && git clone https://github.com/NoiseByNorthwest/php-spx.git /tmp/php-spx \
    && cd /tmp/php-spx \
    && git checkout $(git describe --tags $(git rev-list --tags --max-count=1)) \
    && phpize \
    && ./configure \
    && make \
    && make install \
    && echo "extension=spx.so" > /etc/php/8.5/cli/conf.d/99-spx.ini \
    && rm -rf /tmp/php-spx
Configuring SPX
Next, certain options need to be configured to enable features such as the web UI and to ensure that the interface is appropriately protected.
For example, the previously mentioned web UI should be protected from external access, as a profiler can expose detailed information about an application's execution. It should therefore not simply be exposed to the public internet. SPX allows access to be protected with a key and restricted to specific IP addresses.
For a local development environment, you can usually use a less restrictive configuration to simplify the setup and maintain compatibility with different host environments.
; SPX configuration
; Enables the web UI
spx.http_enabled=1
; Defines the key / password required to access the web UI
spx.http_key="laravel"
; Defines IP addresses allowed to access the web UI
spx.http_ip_whitelist="*"
Rebuilding the image
With the changes applied to the Dockerfile and PHP configuration, the Docker image needs to be rebuilt. Since we have added a new build step, there is no need to use the --no-cache option.
sail build
Once the image has been rebuilt, restart the containers so that they use the newly built image:
sail up -d
The Laravel Sail container is now running with the newly installed SPX extension.
Profiling a Performance Issue
Accessing the SPX Web UI
Simply open your PHP application in your web browser and append the SPX_KEY and SPX_UI_URI parameters, as shown in the following example:
http://localhost/?SPX_KEY=laravel&SPX_UI_URI=/
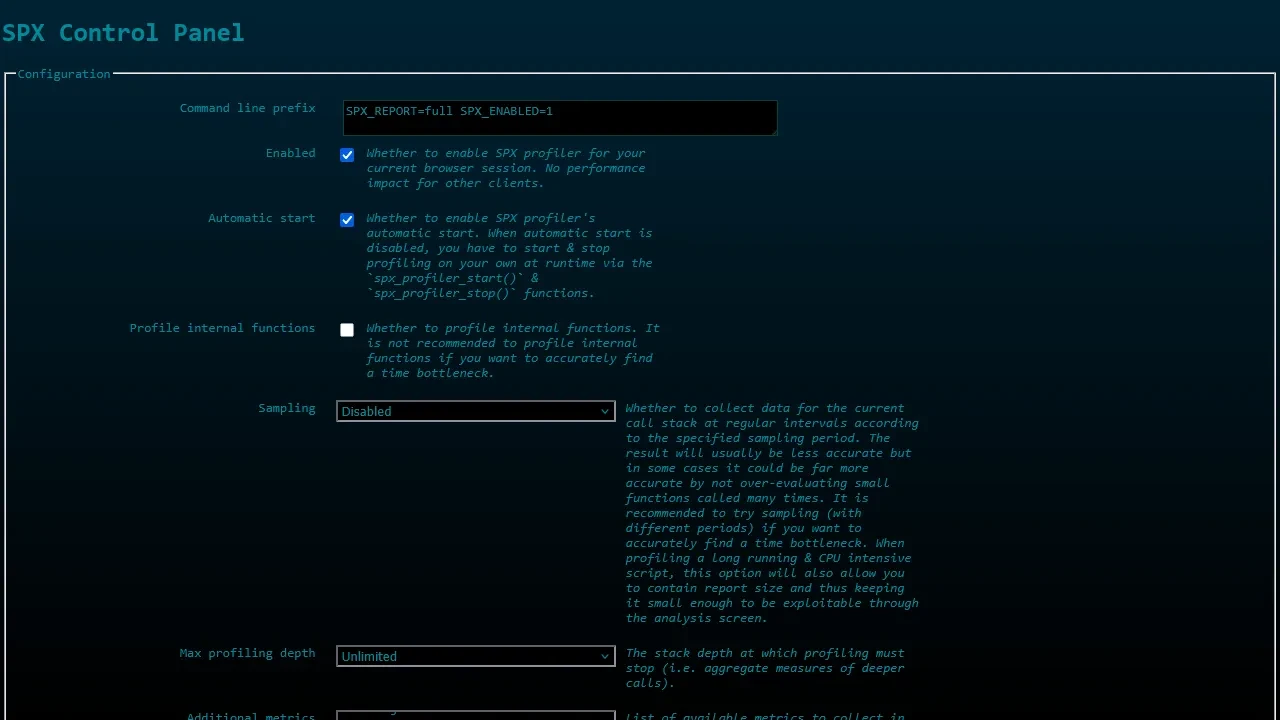
These parameters tell the SPX extension to intercept the request and serve its web UI instead of passing the request through to the application. For now, simply make sure that the Enabled and Automatic Start checkboxes are enabled, as shown below:
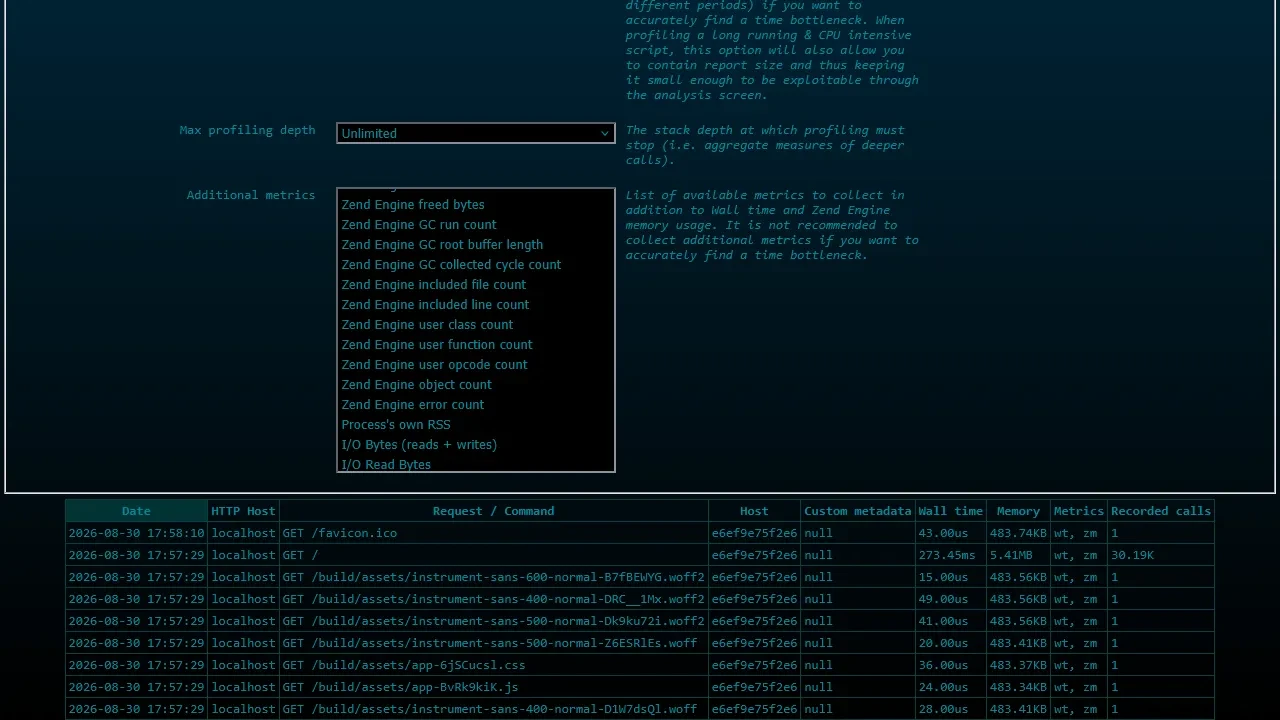
 Now, when you navigate to any route of your application, you should see the individual requests appear at the bottom of the SPX web UI.
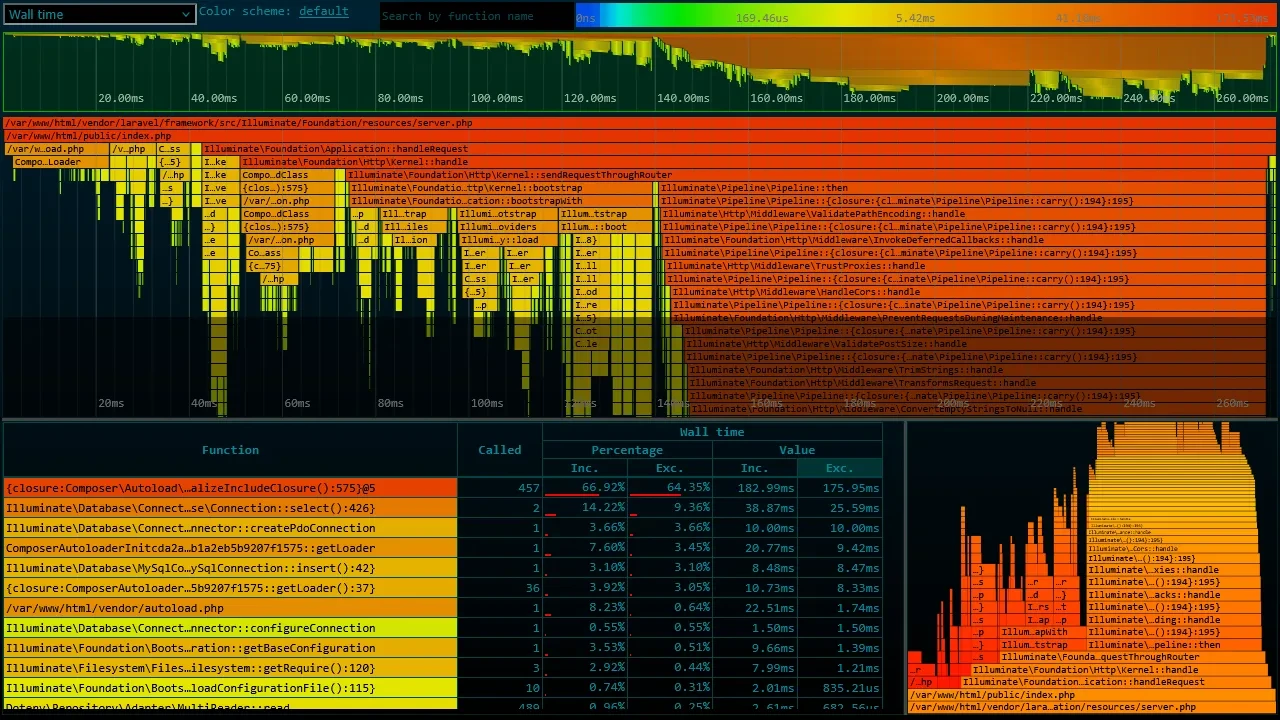
 Click on any request you want to profile in order to open the detailed view. This contains the complete flame graph along with additional information about every method that was executed as part of the request.
Creating a Problematic Scenario
Let's assume that a new package has been installed, perhaps because we are integrating upstream changes to resolve merge conflicts. However, the package or environment is not configured correctly, causing caches to be missed.
To simulate this scenario, I am going to implement an example package with the following Service Provider:
// packages/example/ExampleServiceProvider.php

namespace App\Providers;

use Illuminate\Support\Facades\Cache;
use Illuminate\Support\ServiceProvider;

class ExampleServiceProvider extends ServiceProvider
{
    public function boot(): void
    {
        // Load from cache or build required data
			  if (! Cache::has('example-package-data') {
				    // Build data
					  sleep(5); // Simulate expensive operation by waiting five seconds
				} else {
					  // Load data from cache
				    $data = Cache::get('example-package-data');
				}

    }
}
I will register this Service Provider through the composer.json of the example package.
// packages/example/composer.json

{
    "name": "example/example",
    "description": "Example Laravel package",
    "type": "library",
    "autoload": {
        "psr-4": {
            "Example\\": "./"
        }
    },
    "extra": {
        "laravel": {
            "providers": [
                "Example\\ExampleServiceProvider"
            ]
        }
    }
}
Next, I will install it into the root Laravel application by making the following modifications to Laravel's composer.json:
{
    "repositories": [
        {
            "type": "path",
            "url": "packages/example"
        }
    ],
    "require": {
        "example/example": "*"
    },
    "minimum-stability": "dev"
}
After making these changes, run composer update example/example to ensure that the changes from the package's composer.json are applied to the lockfile.
You should now notice that requests to the application are significantly slower. The Service Provider increases Laravel's boot time by five seconds, meaning that every request now takes approximately five seconds longer than before.
We can now open our browser and make a new request to the Laravel application that we are going to profile in the next step. As expected, this request will also take approximately five seconds longer than usual.
Profiling the Slow Application
Navigate to the SPX web UI and open the request we just made. You can easily identify it by its wall time, which should be slightly above five seconds.
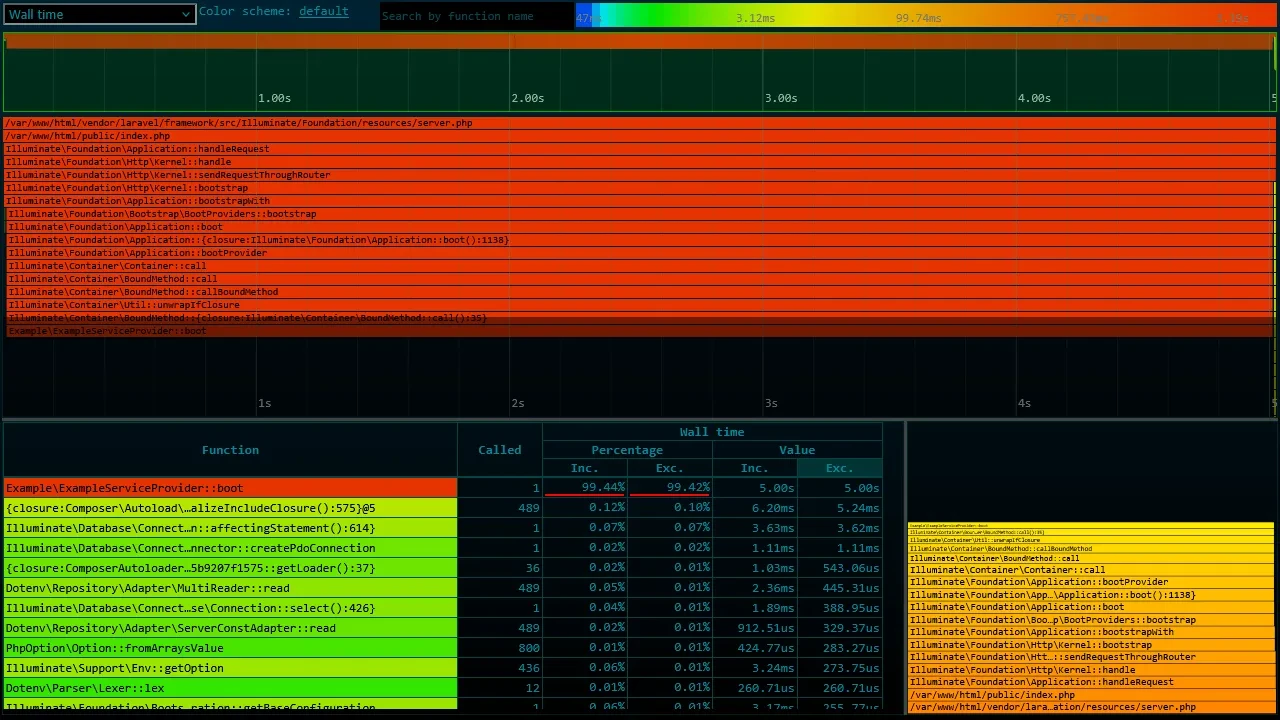 The flame graph should immediately reveal a very large block representing the expensive method call. Looking at the table below, which is sorted by execution time, we can see our
 ExampleServiceProvider at the very top.
As you can see, we have almost immediately identified the offending method and the implementation responsible for our performance issue.
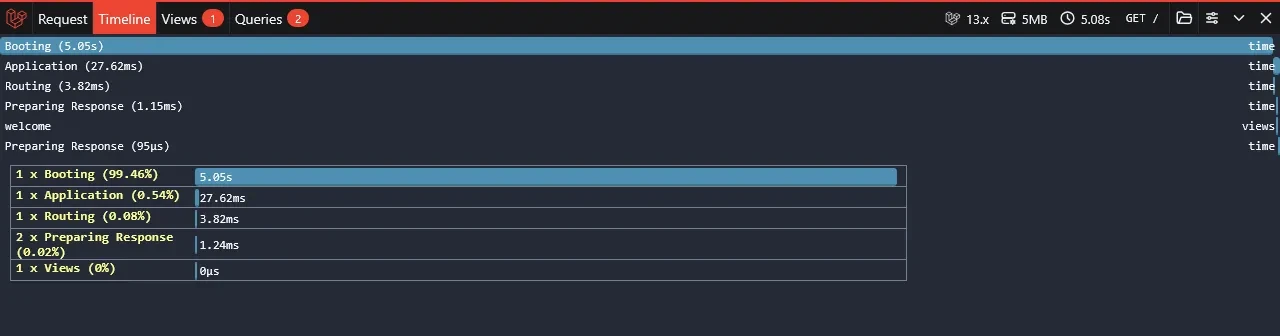
Less detailed tools such as Laravel Debugbar or Telescope can help identify that the application is spending a significant amount of time during its boot process, but they do not provide the same level of function-level profiling information:
Things to Keep in Mind
Profiling should not be treated as a perfect representation of production behavior.
The profiler itself introduces overhead, and the environment in which the application is profiled may differ significantly from production. The numbers should therefore be interpreted as measurements within a particular environment rather than absolute truths.
It is also important not to optimize everything that appears expensive. Some methods are expensive because they have to be. The fact that a function consumes a noticeable amount of time does not automatically mean that it should be changed.
The purpose of profiling is to provide evidence that helps make better engineering decisions, not to turn every line of code into a performance optimization exercise.
SPX should also be treated carefully from a security perspective. Its profiling interface can expose sensitive implementation details and should be restricted appropriately. For this reason, I would generally keep it confined to development and controlled diagnostic environments.
Conclusion
Performance optimization becomes considerably easier when it is based on measurements instead of assumptions.
PHP SPX provides a practical way to inspect the execution of PHP applications and identify the parts that deserve closer attention. Its value is not simply that it can tell you how long a request took, but that it can help explain where that time went.
Combined with a debugger such as Xdebug, it forms a useful part of a PHP developer's toolkit: one tool helps investigate behavior, while the other helps investigate performance.
When an application is slow and the reason is not immediately obvious, the first step does not have to be guessing.
Profile it. Find the bottleneck. Then optimize it.